Internship: JavaScript and user interface software engineer with an interest in map visualization
Why you should do it?
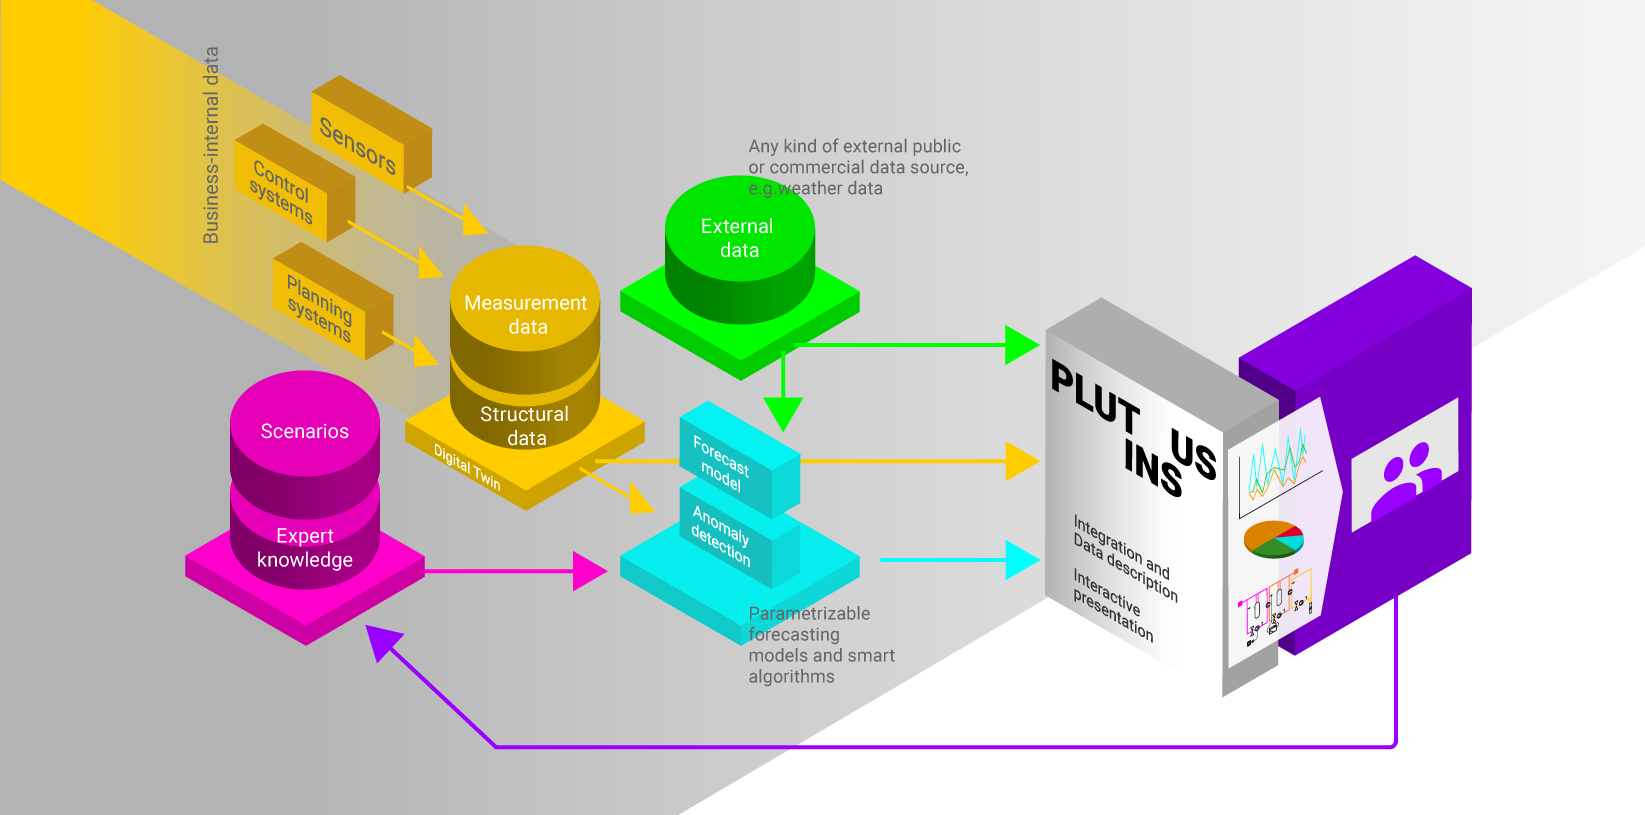
Plutinsus is a research-driven technology start-up that develops innovative data science applications to turn complexities into opportunities. The challenge in this area is to integrate data from a large variety of data sources (fully structured tables, tree-style documents, graph-based networks, geographical maps) in an agile and flexible way with no change to the software required. This data then needs to be made available to all relevant stakeholders – from expert users to sporadic users – in order to help them understand causes and foresee effects.
There is a growing demand for such advanced analytical capabilities, and so the small, entrepreneurial Plutinsus team wants to move forward faster. Everyone makes an impact as progress is all that matters. And progress is needed as Plutinsus moves along the cutting edge and continues to invest in research. Members of the Plutinsus team have been working at various high-tech start-ups for many years, both in Silicon Valley and in Switzerland, and have studied and done research at Stanford University and at universities in Switzerland.
Do you want to be part of this technology innovation?
What you should do?
We have been building our system to visualize tables and charts using scalable vector graphics (SVG) and the JavaScript library D3. We would like to experiment with visualising data from pixel-based maps. Of course, following our main theme of integrating data, we would like to display other data such as, for instance, points and polylines on top of these maps, like a GIS. These points and lines should be able to have additional attributes that change, e.g., their colour, size, line style, legend or mouse-over. We are sure, you will develop ideas that we haven’t thought of. And since another main theme of ours is the many ways that users can interact with the visualisation in order to understand more details of the data, we would like to explore various ideas of how the users can change the display of this data.
Do you want to take up this challenge?
How you should do it?
We certainly haven’t got all the answers. We may not even have got all the questions. This project may require looking at a number of examples in this area. You may already have some knowledge or want to learn more about data visualization and interaction design. We want to try out some of the newest technologies together with you. Therefore, we foster a collaborative working culture and are all in it together. Hence, you can expect to be supported by and to learn from experienced experts in this field in order to discuss your ideas and to demonstrate your code. You can enjoy great flexibility with respect to when and where you want to work. This independence should be matched with a good communication style.
Do you have what it takes to make this project a success?
If you have answered these three questions with “yes” then contact Wolfram Willuhn at wolfram@plutinsus.com to discuss your internship opportunity.